Detecting pollutants in a Cherry Blossom leaf
Plant samples such as leaves are a challenging sample for ToF SIMS. Composed of insulating materials such as cellulose (cell walls) and lipophilic coatings (cuticular layer), charge build up can affect measurement quality. Using an electron gun during analysis can alleviate the charging effect and enables 3D analysis of the surface of a leaf.
Cherry blossom leaves (Prunus serrulata) collected in a busy city were analysed on the J105 SIMS using a 40 kV C60 ion beam. Pieces of blossom leaves were mounted onto double sided tape, attached to a sample stub, and gently pressed down in the corners to ensure best possible contact without deforming the leaf surface. Overview images were acquired on both sides of the leaf surface, with a spatial resolution of 1 µm per pixel and a primary ion dose of 2.2×10¹³ ions/cm2.
Experimental Conditions
| Ion Beam: | 40kV C60+ |
| Dose: | 2.2×10¹³ ions/cm2 |
| Spatial Resolution: | 1 μm |
| Charge Compensation: | 60V Electron Gun, 25V Stage Bias |
Without charge compensation, no secondary ions could be detected. Applying an ever-increasing stage bias would produce secondary ions temporarily. Only a combination of charge compensation methods via a 25 V pulsed stage bias and electrons emitted at 60 V beam energy enable us to generate an image of the leaf surface as well as steady signal during depth profiling.
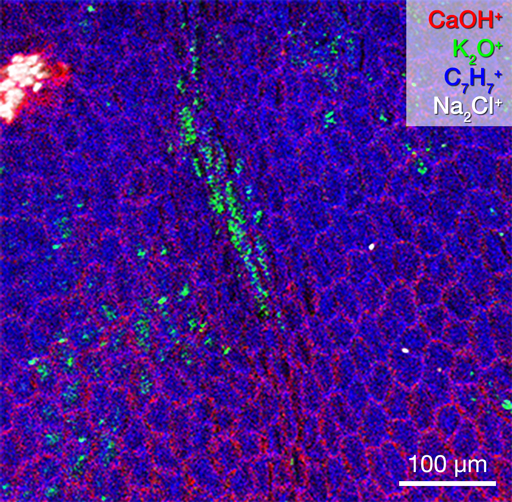
Surface analysis reveals the outline of single plant cells. The outlines of the cells contain CaOH (m/z 56.97), while inorganic compounds such as K2O+ (m/z 93.92), Na2Cl+ (m/z 80.95), and Fe+ (m/z 55.93) are unevenly dispersed on the surface of the leaf. All compounds identified across the uneven leaf surface have a mass accuracy < 5 ppm (Table 1).
Analysis also revealed the surface to be coated with an even layer of organic compounds represented by molecules containing aromatic structures, e.g. tropylium ion, C7H7+ (m/z 91.05). Wax coatings on plants take the form of long aliphatic carbon chains, so aromatic structures such as these are unexpected and may indicate the presence of gasoline pollutants such as BTX (benzene, toluene, xylene).
Analysis of complex, insulating, and uneven samples such as these is made routine on the J105 SIMS.
Depth profile analysis reveals that as the cells are etched away, the layer of aromatic compounds reappears on the underside of the sample. Additionally, potassium containing substances are detected that are not present on the surface and only occur within certain cell walls (Figure 1 inset, green).
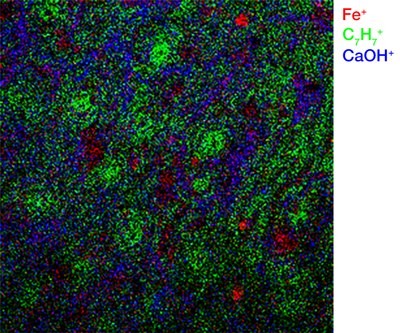
Repeating the analysis on the lower epidermis reveals a high concentration of aromatic signals surrounding the stomata (Figure 2, green). It is known that plants can absorb pollutants such as BTX, mainly through the stomata, giving further evidence to the origin of these compounds.
Analysis of complex, insulating, and uneven samples such as these is made routine on the J105 SIMS. Performing high-resolution 3D analysis with high sensitivity creates a more complete picture, enabling a greater understanding of the sample and its environment.
We gratefully acknowledge NESAC/BIO and the University of Washington for the use of their data in this work.
For further information about our instruments or to arrange a demonstration, please get in touch via our Contact page.

 Ionoptika 2020
  Ionoptika
  Ionoptika Ltd
  Ionoptika Ltd