Depth Profiling in ToF-SIMS with the J105 SIMS
Depth profiling is a powerful technique in surface analysis for examining interfaces and exploring the 3-dimensional structures of a material, to which SIMS is uniquely suited.
Many modern instruments are equipped with a sputter ion beam in addition to their primary analysis beam for depth profiling. This enables users to perform “etch-cycles” in-between analysis cycles, thereby building up a stack of 2D images and generating a 3-dimensional view of the sample.
There are limitations to the use of SIMS for depth-profiling however. Unlike non-destructive techniques such as XPS, SIMS alters the surface during analysis. In fact, fragmentation and migration of species can occur up to 20 nm below the surface. Etch-cycles therefore perform several duties. 1. They enable 3D image capture in a realistic time-frame, and 2. they remove the damaged layers, leaving behind a relatively clean surface for the subsequent analysis cycle. This process has some obvious drawbacks, most notably that a significant amount of material is lost during each cycle. This can severely limit the depth resolution.
As the J105 SIMS uses a dual-stage ToF analyzer, any beam may be employed as the primary analysis beam, including C60 and gas cluster beams. In this case, additional etch-cycles are not required – analysis and low-damage etching are continuous and concurrent. This means that no data is lost and all the material is sampled, making the J105 SIMS an extremely accurate tool for depth profile analysis.
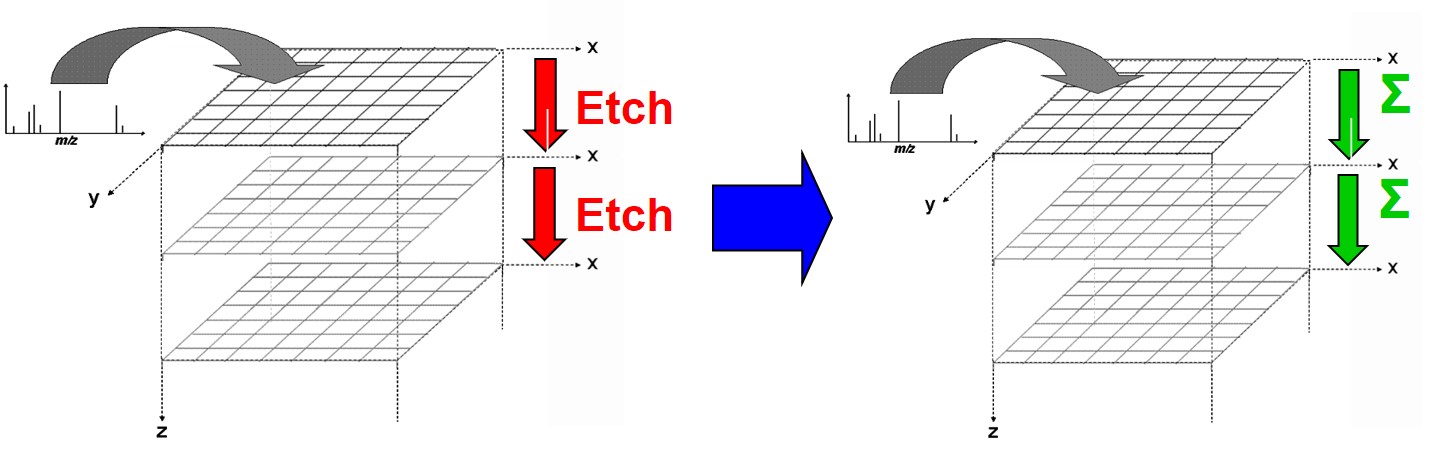
As the J105 uses a DC beam, there is no need to interlace an etching beam with the analysis beam as analysis and low-damage etching are continuous and concurrent.
Organic Samples
In 2015, NPL led a VAMAS study comparing compositional analysis of an organic layered structure using both SIMS and XPS. The stack consisted of layers of Irganox 1010 and either Irganox 1098 (denoted MMK) or Fmoc-pentafluoro-Lphenylalanine (denoted MMF) in well defined ratios.
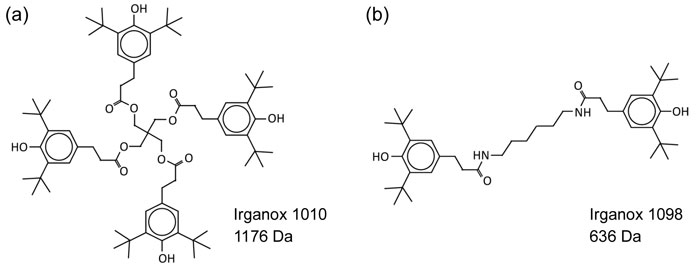
Chemical structure of (a) Irganox 1010, and (b) Irganox 1098.
Compared with a number of instruments using a Bin+ analysis beam, the J105 SIMS, using a 40 kV Ar4000+ beam, achieved the highest depth resolution of any instrument, demonstrating 12.8 nm. The figure below shows an example depth profile of such an organic stack structure.
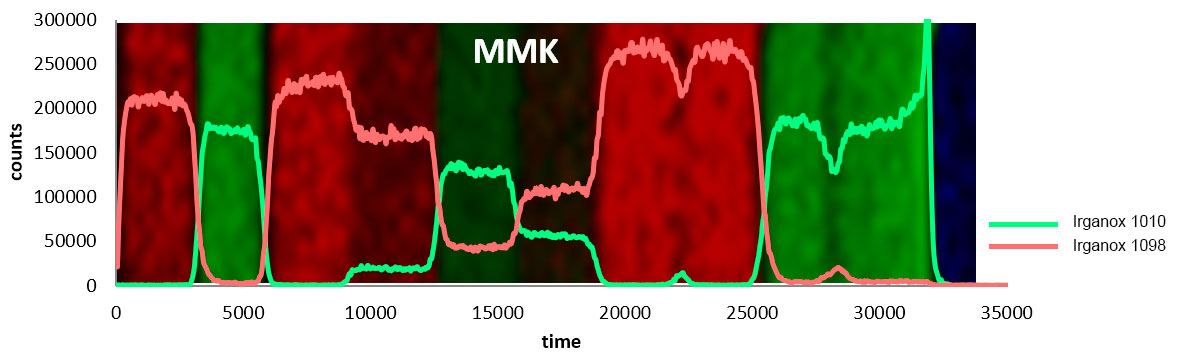
Depth profile of a stacked Irganox 1010/Irganox 1098 sample. The J105 SIMS demonstrated a depth resolution of 12.8 nm – the highest of any instrument in the study.
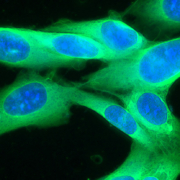
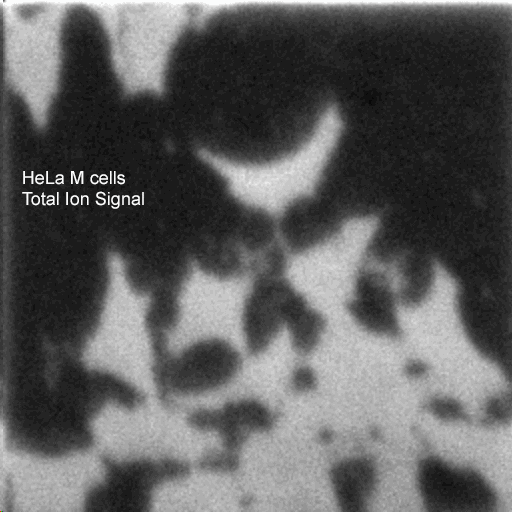
HeLa cells
Depth profiling may also be used to produce 3D chemical maps of complex structures. The example below shows a 3D reconstruction of HeLa cells – an immortal human cervical cell line. The lipid phosphocholine head group (m/z 184.1), shown in green, represents the cell membrane, while the nucleic acid adenine (m/z 135.1), shown in red, represents the nucleus.
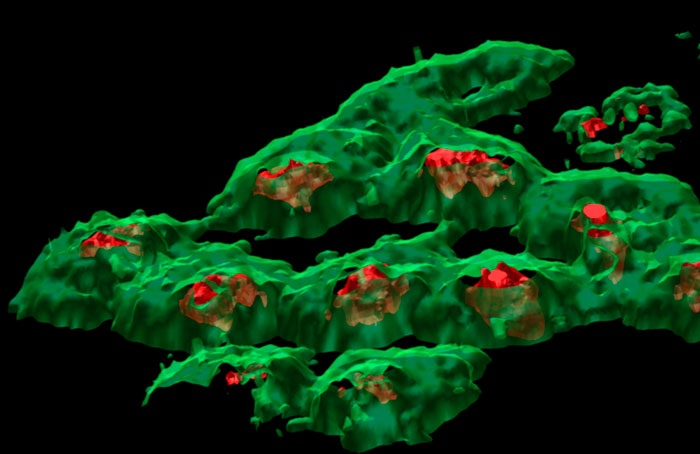
3D chemical mapping of HeLa cells using a 40 kV C60 beam. Phosphocholine (m/z 184.1 – green) and adenine (m/z 135.1 – red) represent membrane and nucleus respectively. Data courtesy of John Fletcher.
Such 3D reconstructions, detailed by Fletcher, Rabbani, and Henderson et al. here, require extensive post-processing of the data to convert the 2D layers – which have no height information – into a 3D image that is representative of the actual structure. The result, however, is a stunning reconstruction of the cell structure, that is made possible by the ability of the J105 SIMS to capture a complete spectrum from each voxel without loss of data.
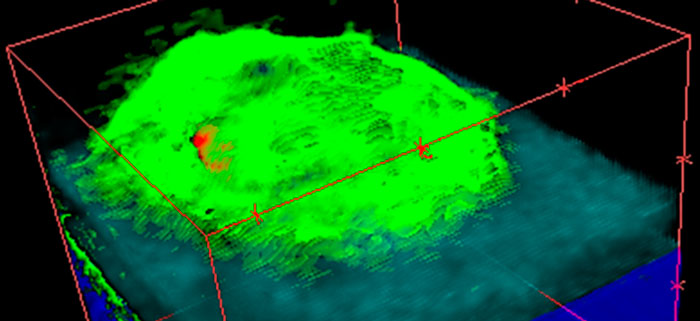
The animation below reveals how the cell membrane is gradually removed to reveal the internal contents – in this case, depicted by the void created in cells.
Depth profiling through HeLa cells using a 50 kV (CO2)5000+ beam at 1 μm per pixel. The lipid layer (phosphocholine) @ m/z 184.1 – representing the cell membrane, is gradually etched away, revealing the contents of the nucleus (adenine) @ m/z 135.1. Data courtesy of Hua Tian.
Inorganic Samples
The properties of poly-atomic ion beams such as gas clusters and C60+ are particularly useful for the analysis of organic samples, and have allowed molecular depth profiling to become a reality. However, that does not mean that such ion beams do not also provide benefits on inorganic samples. In fact, C60 ion beams are uniquely useful for use on both organic and inorganic samples.
Sputtering under C60+ has been shown to be less sensitive to variation in material, incidence angle, and crystallinity of the sample and has been show to offer improvements in quantitation and reproducibility on glass/mineral standards, and therefore provide an excellent solution for depth profiling on these types of samples.
NIST Ni:Cr Standard
The performance of 40 keV C60+ on a metal multilayer sample is demonstrated on the Ni:Cr standard reference material from NIST. The sample comprises alternating layers of Ni and Cr on a silicon wafer substrate. The plot on the left shows the signal from the m/z 52, and 58 mass channels corresponding to the Cr and Ni respectively. The Ni layers are 66 nm thick and the Cr layers 53 nm. A depth resolution of ca. 5 nm is calculated (16-84% rising edge of 1st Ni layer). This is close to the expected crater depth of a single C60+ impact.
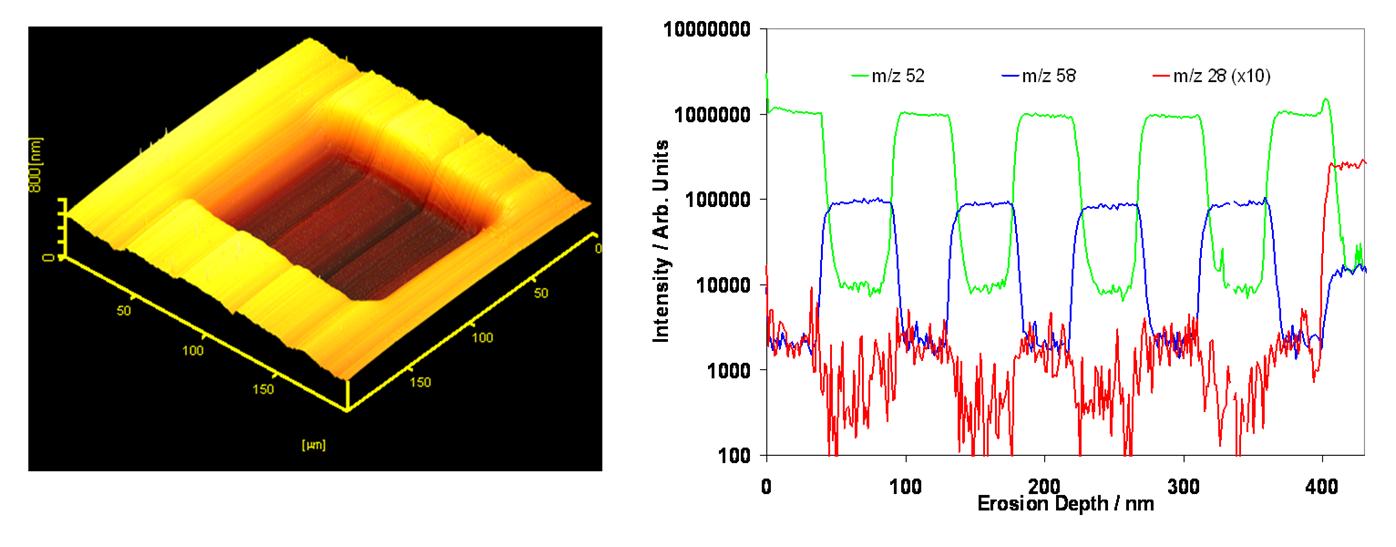
40 keV C60+ depth profile through the NIST Ni:Cr standard showing < 5 nm depth resolution.
Mixed Metal Oxide Sample
The example below is a depth profile through a mixed metal oxide material of relevance in hydrogen fuel cell fabrication. The experiment was performed using a C60+ 40 keV primary ion beam rastered over a 150 × 150 µm2 field of view. The J105 provides excellent signal to noise as all the material is collected during the depth profile similar to a dynamic-SIMS instrument but with the parallel mass detection and mass range of a time-of-flight analyzer. Decoupling the mass spectrometry from the ion generation process also means that the mass resolution is not compromised, and mass accuracy and calibration does not drift as the sample is eroded. Depth profiles and 3D images are generated retrospectively from the “image stack” with the outermost pixels discarded to remove any crater-wall artifacts.
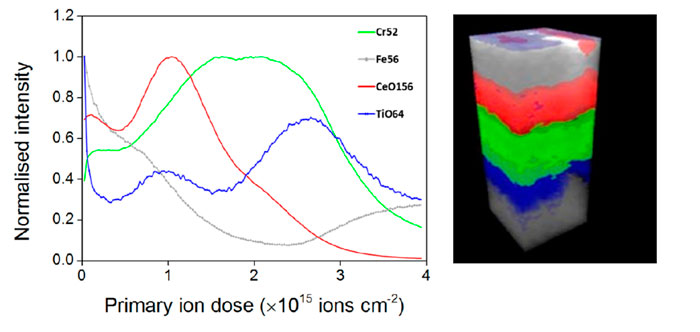
Variation in secondary ion signal as a function of primary ion beam fluence for Cr+, Fe+, CeO+, and TiO+ displayed in the profile and 3D reconstruction in green, grey, red, and blue respectively. 150 x 150 μm2 field of view, z depth approximately 600 nm.
The composition of this sample is in fact much more complex than shown in the above plot and 3D rendering, and contains Al, Mn, Cr, Ce, Fe, Ti and oxides of these metals all of which are observed clearly in the mass spectra through the profile, in addition there is a thin layer of Na and K on the very surface of the sample (not shown).
Conclusions
The J105 SIMS provides an excellent solution for depth profiling of samples. The ability to use a variety of cluster beams for continuous and concurrent analysis and low-damage etching, without the need for “etch-only” cycles, enables high depth resolution on any sample type. If you would like more information, or would like to speak to a member of our team, please get in touch via our Contact page.
 Ionoptika 2020
 Ionoptika
  Ionoptika Ltd
  Ionoptika Ltd